Logo for GPM Applications showing ecology, water and agriculture, energy, disasters, health, and weather.

Applications


Image

Overview

The Global Precipitation Measurement (GPM) mission has several cross-cutting application areas which contribute to and enhance our understanding of weather forecasting, disasters, ecology, health, water and agriculture and energy. Using advanced space-borne instruments, GPM measures light rain to heavy rain and falling snow, producing a near-global view of precipitation every 30 minutes. Through improved measurements of rain and snow, precipitation data from the GPM mission is used by a diverse range of applications and user communities at local to global scales to inform decision making and policy that directly benefits society. 

Sections

What are Applications? 

“Applications” refers to the use of mission data products in decision-making activities for societal benefit. Mission Applications take a satellite's data products and expands them into areas where they can help inform policy or decisions. 

Learn more about Applied Sciences at NASA

Who's Using GPM Data?

Learn about the different people and organizations that are using GPM and other NASA Earth data to help improve life around the world. 

View Articles


GPM Mentorship Program

NASA’s GPM applications team and University of Coimbra’s Earth and Space Science Center (CITEUC Portugal) have collaborated to host the GPM Mentorship Program for several years.

The program supports users from established and underrepresented user communities to provide a tailored hands-on learning experience in using GPM data for applications. It provides participants with training and tools to use state-of-the-art GPM satellite-based precipitation estimates, and helps them apply GPM data to support real-world problems and benefit their communities. 

Learn more about each GPM Mentorship Program session2024, 2023, 2022


GPM Data for Decision Making

Are you using GPM satellite precipitation data in your work, or would you like to? Share your story with our team, or ask us any questions you may have using our contact form.

We also encourage you to get involved in GPM applications by attending an applications event or accessing the free and publicly available data in the data section of this site

  • Dalia Kirschbaum (NASA GSFC), GPM Mission Associate Deputy Project Scientist for Applications
  • Andrea Portier (NASA GSFC / SSAI), GPM Applications and Outreach Coordinator
  • Dorian Janney (NASA GSFC / ADNET), GPM Outreach Specialist
  • Jacob Reed (NASA GSFC / Telophase), GPM Web Developer

Applications Featured Resources

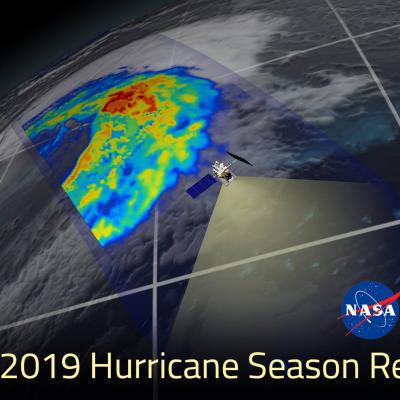
2019 Hurricane Season Banner
NASA has a unique and important view of hurricanes around the planet. Satellites and aircraft watch as storms form, travel across the ocean and sometimes, make landfall. After the hurricanes have passed, the satellites and aircraft see the aftermath of hurricanes, from downed forests to mass power loss.
GPM Catches Typhoon Yutu Making Landfall
NASA's GPM Core observatory satellite captured an image of Super Typhoon Yutu when it flew over the powerful storm just as the center was striking the central Northern Mariana Islands north of Guam. Early Thursday, Oct. 25 local time, Super Typhoon Yutu crossed over the U.S. commonwealth of the Northern Mariana Islands. It was the equivalent of a Category 5 hurricane. The National Weather Service in Guam said it was the strongest storm to hit any part of the U.S. this year. Download this video in high resolution from the NASA Goddard Scientific Visualization Studio Download video without...
Dive Into a 360-View of Hurricane Maria
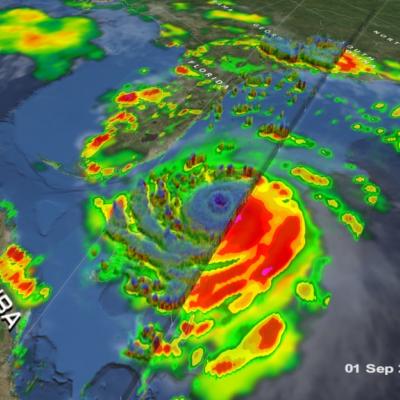
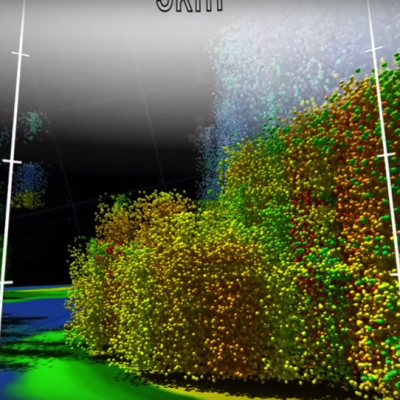
Two days before Hurricane Maria devastated Puerto Rico, the NASA/JAXA Global Precipitation Measurement Core Observatory satellite captured a 3D view of the 2017 storm. At the time Maria was a category 1 hurricane. The 3-D view reveals the processes inside the hurricane that would fuel the storm’s intensification to a category 5 storm within 24 hours. For the first time in 360 degrees, this data visualization takes you inside the hurricane. The precipitation satellite has an advanced radar that measures both liquid and frozen water. The brightly colored dots show areas of rainfall, where green...
GPM Flies Over Tropical Cyclone Florence
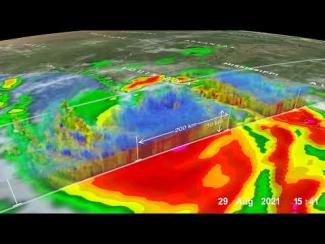
Download in High Resolution from the NASA Goddard Scientific Visualization Studio GPM passed over Tropical Storm Florence on September 7, 2018. As the camera moves in on the storm, DPR's volumetric view of the storm is revealed. A slicing plane moves across the volume to display precipitation rates throughout the storm. Shades of green to red represent liquid precipitation. Frozen precipitation is shown in cyan and purple. NASA's Global Precipitation Measurement mission or GPM core observatory satellite flew over Tropical Storm Florence on September 7, 2018. At that time, the storm was...
NASA Rainfall Data and Global Fire Weather
The Global Fire WEather Database (GFWED) integrates different weather factors influencing the likelihood of a vegetation fire starting and spreading. It is based on the Fire Weather Index (FWI) System, which tracks the dryness of three general fuel classes, and the potential behavior of a fire if it were to start. Each day, FWI values are calculated from global weather data, including satellite rainfall data from the Global Precipitation Measurement (GPM) mission.
Using Precipitation Data to Track Cholera
Diarrheal diseases such as cholera continue to be a public health threat. Prediction of an outbreak of diarrheal disease, specifically cholera, following a natural disaster remains a challenge, especially in regions lacking basic safe civil infrastructure such as water, sanitation and hygiene (WASH). The underlying mechanism of a cholera outbreak is associated with disruption in the human access to safe WASH infrastructure that results in the population using unsafe water containing pathogenic vibrios. Presence and abundance of Vibrio cholerae, the causative agent of cholera, are related to modalities of the environment and regional weather as well as the climate systems.
Help NASA Create the Largest Landslide Database
Landslides cause thousands of deaths and billions of dollars in property damage each year. Surprisingly, very few centralized global landslide databases exist, especially those that are publicly available. Now NASA scientists are working to fill the gap—and they want your help collecting information.
Modeling Landslide Threats in Near Realtime
For the first time, scientists can look at landslide threats anywhere around the world in near real-time, thanks to satellite data and a new model developed by NASA. The model, developed at NASA's Goddard Space Flight Center in Greenbelt, Maryland, estimates potential landslide activity triggered by rainfall. Rainfall is the most widespread trigger of landslides around the world. If conditions beneath Earth's surface are already unstable, heavy rains act as the last straw that causes mud, rocks or debris — or all combined — to move rapidly down mountains and hillsides. A new model has been...
GPM Sees Powerful Winter Storm Grayson
Powerful Coastal Storm Brings Snow, Extreme Cold, Wind and Blizzard Conditions to the East Coast View an interactive 3D visualization of GPM data from Winter Storm Grayson in STORM Event Viewer Mobile version Cold Artic air has been keeping the vast majority of the country east of the Rockies in the deep freeze over the past week. Now a powerful coastal storm is working its way up the East Coast bringing a mixture of snow, freezing rain, high winds and blizzard conditions from as far south as Florida all the way up into Maine with blizzard warnings in effect along the coast from North Carolina...
GPM Catches Hurricane Nate's Landfall
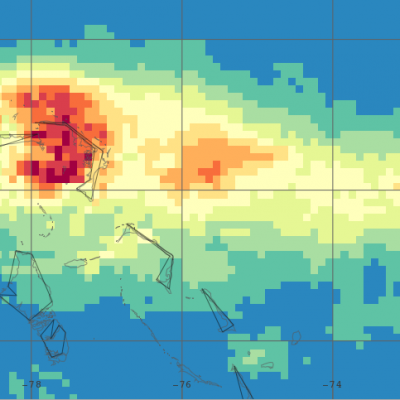
NASA's GPM satellite helped track Nate's progress through the Gulf of Mexico and also captured Nate's landfall on the north central Gulf Coast. This animation shows instantaneous rainrate estimates from NASA's Integrated Multi-satellitE Retrievals for GPM or IMERG product over North America and the surrounding waters beginning on Thursday October 5th when Nate first became a tropical storm near the northeast coast of Nicaragua in the western Caribbean until its eventual landfall on the northern Gulf Coast on Sunday October 8th.

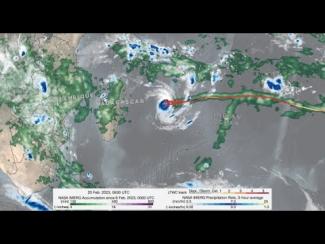
GPM IMERG precipitation rates and totals from Tropical Cyclone Freddy, Feb. 6 - March 12, 2023. Credit: NASA 

Download in high resolution from the NASA Goddard Scientific Visualization Studio

In a series of three half-day virtual meetings, this workshop will focus on current applications and future opportunities of NASA precipitation and cloud data products to support transport and logistical activities for aviation, maritime, roads and highway transportation systems. The workshop will bring together representatives from federal and state operational agencies and private companies to discuss how NASA precipitation and cloud products could be better leveraged to inform decision-making for transport and logistical operations. The workshop will also provide an opportunity for end...

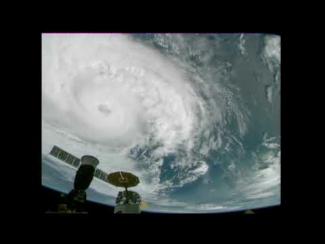
Cameras outside the International Space Station captured dramatic views of Hurricane Zeta at 12:50 pm ET October 28, as it churned 200 miles south-southwest of New Orleans packing winds of 90 miles an hour. Credit: NASA International Space Station

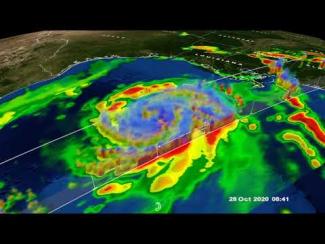
GPM Core Observatory overpass of Tropical Storm Zeta on October 28 at approximately 3:25am CDT (8:25 UTC). Credit: NASA Goddard Scientific Visualization Studio

View an interactive 3D visualization of this overpass in STORM Event Viewer

Hide Body

Hide Date

Hide Main Image

Hide Title