Logo for GPM Applications showing ecology, water and agriculture, energy, disasters, health, and weather.

Applications


Overview

The Global Precipitation Measurement (GPM) mission has several cross-cutting application areas which contribute to and enhance our understanding of weather forecasting, disasters, ecology, health, water and agriculture and energy. Using advanced space-borne instruments, GPM measures light rain to heavy rain and falling snow, producing a near-global view of precipitation every 30 minutes. Through improved measurements of rain and snow, precipitation data from the GPM mission is used by a diverse range of applications and user communities at local to global scales to inform decision making and policy that directly benefits society. 

Sections

What are Applications? 

“Applications” refers to the use of mission data products in decision-making activities for societal benefit. Mission Applications take a satellite's data products and expands them into areas where they can help inform policy or decisions. 

Learn more about Applied Sciences at NASA

Who's Using GPM Data?

Learn about the different people and organizations that are using GPM and other NASA Earth data to help improve life around the world. 

View Articles


GPM Mentorship Program

NASA’s GPM applications team and University of Coimbra’s Earth and Space Science Center (CITEUC Portugal) have collaborated to host the GPM Mentorship Program for several years.

The program supports new and existing user communities to provide a tailored hands-on learning experience in using GPM data for applications. It provides participants with training and tools to use state-of-the-art GPM satellite-based precipitation estimates, and helps them apply GPM data to support real-world problems and benefit their communities. 

Learn more about each GPM Mentorship Program session2024, 2023, 2022


GPM Data for Decision Making

Are you using GPM satellite precipitation data in your work, or would you like to? Share your story with our team, or ask us any questions you may have using our contact form.

We also encourage you to get involved in GPM applications by attending an applications event or accessing the free and publicly available data in the data section of this site

  • Dalia Kirschbaum (NASA GSFC), GPM Mission Associate Deputy Project Scientist for Applications
  • Andrea Portier (NASA GSFC / SSAI), GPM Applications and Outreach Coordinator
  • Dorian Janney (NASA GSFC / ADNET), GPM Outreach Specialist
  • Jacob Reed (NASA GSFC / Telophase), GPM Web Developer

Applications Featured Resources

Banner for the GPM Disease Initiative
Vector-borne diseases are responsible for over 17% of all the infectious diseases globally. Many of these diseases are preventable through protective measures, provided local authorities are aware of the potential outbreaks of the responsible vectors. Vectors are living organisms that are able to transmit diseases between humans or from animals to humans. These diseases include but are not limited to cholera, malaria, dengue fever, Zika, schistosomiasis, and West Nile fever.
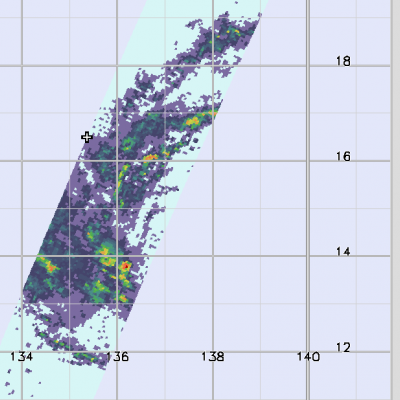
Typhoon Kammuri Hits the Central Phiippines
While the Atlantic hurricane season officially ended on November 30th, Typhoon Kammuri (known as Tisoy in the Philippines), which recently struck the central Philippines as a powerful Category 4 typhoon, is a reminder that the Pacific typhoon season is not yet over. In fact, while typhoon season does peak from around June through November, similar to the Atlantic, typhoons can occur throughout the year in the Pacific. Kammuri first formed into a tropical depression from an area of low pressure on the 25th of November north of Micronesia in the west central Pacific about 500 miles southeast of Guam.
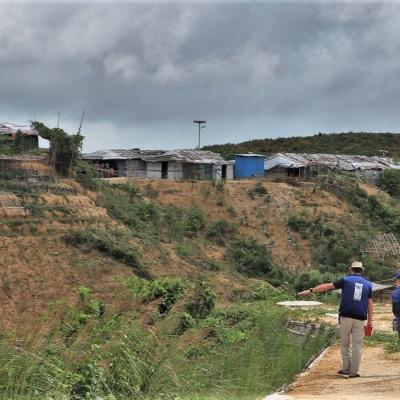
GPM Data Mitigates Landslide Risks in Bangladesh
Camp managers and other local officials overseeing Rohingya refugee camps in Bangladesh are now incorporating NASA satellite observations into their decision making in order to reduce the risk to refugees from landslides and other natural hazards. Information like daily rain totals can help inform how to lay out refugee camps and store supplies. More than 740,000 Rohingya refugees have fled to Bangladesh since August 2017. Many of them have sought shelter in camps located in the hilly countryside, where landslide risk may be the greatest. Increasing this danger is Bangladesh’s intense monsoon season. Approximately 80 percent of Bangladesh's yearly rain falls in just five months, from June to October, bringing with it an increased risk of flash flooding and landslides.
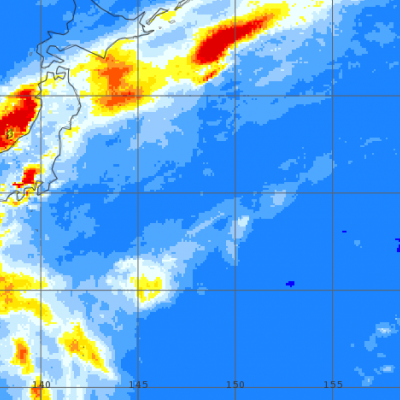
Typhoon Hagibis Brings Heavy Rains to Japan
Typhoon Hagibis, a once powerful super typhoon, struck the main Japanese island of Honshu over the weekend, bringing very heavy rains and widespread flooding. Hagibis formed into a tropical storm on the 5th of October from a tropical depression that originated from a westward moving tropical wave north of the Marshall Islands. At first, Hagibis strengthened steadily becoming a typhoon about 24 hours after becoming a tropical storm. But, then on the 7th, Hagibis underwent a remarkable rapid intensification cycle and quickly intensified into a super typhoon with sustained winds estimated at 160 mph by the Joint Typhoon Warning Center (JTWC) less than 24 hours after becoming a minimal typhoon.
Using the IMERG Long-term Precipitation Data for Applications
A long precipitation data set like the new GPM IMERG V06 product is valuable for many applications and for decision-making. Accurate and reliable precipitation records are not only crucial to understanding trends and variability but also for water management resources and food security, ecological management, and weather, climate and hydrological forecasting. Here we present a few highlights showcasing how GPM IMERG is helping a variety of end users make decisions that will benefit society for years to come. GPM IMERG Data Used for Wind Energy Map of average precipitation in north-central...
GPM observes Hurricane Dorian lashing Florida
Download in high resolution from the NASA Goddard Scientific Visualization Studio GPM captured Dorian at 10:41 UTC (6:41 am EDT) on the 4th of September when the storm was moving north-northwest parallel to the coast of Florida about 90 miles due east of Daytona Beach. Three days earlier, Dorian had struck the northern Bahamas as one of the most powerful Category 5 hurricanes on record in the Atlantic with sustained winds of 185 mph. Weakening steering currents allowed the powerful storm to ravage the northern Bahamas for 2 full days. During this time, Dorian began to weaken due to its...
GPM Observes Hurricane Dorian Over Bahamas
Download in high resolution from the NASA Goddard Scientific Visualization Studio. The NASA / JAXA Global Precipitation Measurement (GPM) Core Observatory flew over Hurricane Dorian on September 1st (5:22pm ET / 21:22 UTC) as the storm was directly over Abaco Island in The Bahamas. The satellite captured data on rainfall rates within the storm as it flew over using its Dual-frequency Precipitation Radar (DPR) and GPM Microwave Imager (GMI). In this animation the multi-satellite GPM IMERG product is shown first to illustrate rainfall rates prior to the overpass. When the camera zooms in data...
Hurricane Dorian Brings Heavy Rain to Bahamas
In addition to the powerful winds that have raked the northern Bahamas over the past few days, Hurricane Dorian’s slow motion has brought very heavy rainfall to the islands as well. Dorian first formed into a tropical depression on the 24th of August about 800 miles east southeast of Barbados in the Lesser Antilles from an area of low pressure; the depression was quickly upgraded to a minimal tropical storm and named Dorian by the National Hurricane Center (NHC) later in the day. As Dorian made its way westward under the influence of a high pressure ridge to the north, it was held in check...
IMERG Measures Rainfall in Hurricane Dorian
UPDATE 9/9/19: On Monday morning, September 9, Hurricane Dorian was a post-tropical storm after a mid-latitude weather front and cold seas had altered its tropical characteristics over the weekend. On Saturday and Sunday, Hurricane Dorian struck eastern Canada, causing wind damage and bringing heavy rainfall. According to the Associated Press, a peak of 400,000 people were without power in Nova Scotia, Canada, because of Dorian. This graphic shows precipitation that fell during the almost two-week period from August 27 to the early hours of September 9. The near-realtime rain estimates come...
Rain Patterns During the Alaska Wildfires
NASA's satellite-based estimate of global precipitation can provide valuable information to officials monitoring the many wildfires in Alaska this summer. Wildfires occur in Alaska each summer, but July 2019 is shaping up to be a particularly active month. Few rain gauges exist in the large tracts of Alaskan wilderness, but wildfires unchecked can spread to populated areas within the state. Satellite-based precipitation estimates are particularly valuable here because of precipitation's relationship to wildfire hazard. The movie shows NASA's IMERG precipitation estimates for May 1 through July...

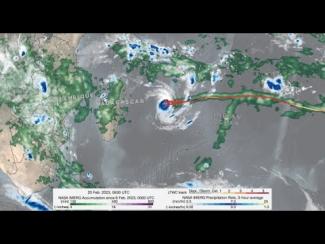
GPM IMERG precipitation rates and totals from Tropical Cyclone Freddy, Feb. 6 - March 12, 2023. Credit: NASA 

Download in high resolution from the NASA Goddard Scientific Visualization Studio

In a series of three half-day virtual meetings, this workshop will focus on current applications and future opportunities of NASA precipitation and cloud data products to support transport and logistical activities for aviation, maritime, roads and highway transportation systems. The workshop will bring together representatives from federal and state operational agencies and private companies to discuss how NASA precipitation and cloud products could be better leveraged to inform decision-making for transport and logistical operations. The workshop will also provide an opportunity for end...

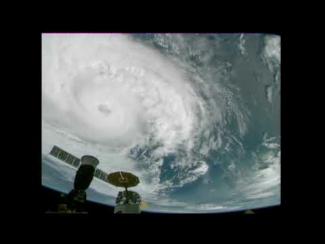
Cameras outside the International Space Station captured dramatic views of Hurricane Zeta at 12:50 pm ET October 28, as it churned 200 miles south-southwest of New Orleans packing winds of 90 miles an hour. Credit: NASA International Space Station

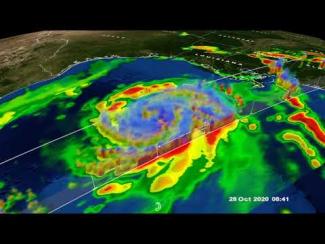
GPM Core Observatory overpass of Tropical Storm Zeta on October 28 at approximately 3:25am CDT (8:25 UTC). Credit: NASA Goddard Scientific Visualization Studio

View an interactive 3D visualization of this overpass in STORM Event Viewer

Hide Body

Hide Date

Hide Main Image

Hide Title