Deadly Southern Asia Flooding Rainfall Measured By NASA's IMERG
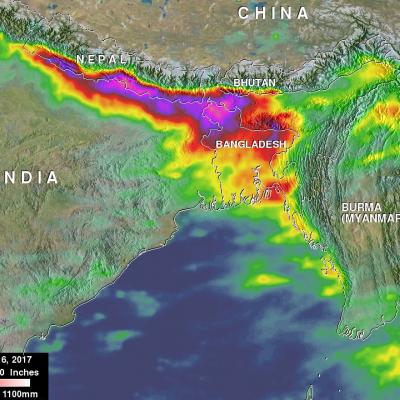
Deaths of over 250 people have resulted from extremely heavy monsoon rainfall in parts of northern India, Bangladesh and Nepal. The death toll from flooding and landslides is expected to continue increasing. Heavy monsoon rainfall is normal in southern Asia this time of year but precipitation totals this year are higher than expected. Recent heavy rainfall is also causing the Brahmaputra and Ganges Rivers rivers to continue rising. This rainfall analysis over southern Asia was created using IMERG real time data covering the period from August 10-16, 2017. Total rainfall IMERG estimates of over