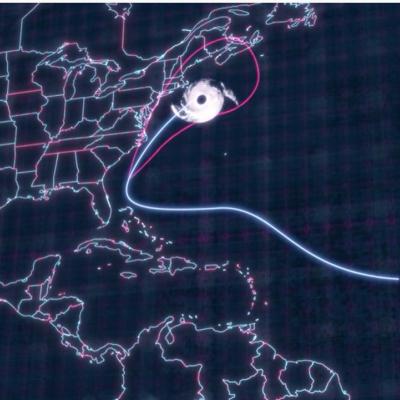
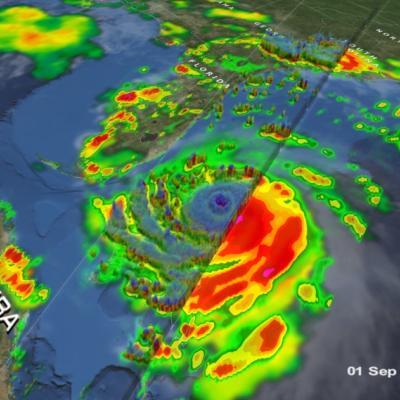
Logo for GPM Applications showing ecology, water and agriculture, energy, disasters, health, and weather.

Applications Articles

Using the IMERG Long-term Precipitation Data for Applications
A long precipitation data set like the new GPM IMERG V06 product is valuable for many applications and for decision-making. Accurate and reliable precipitation records are not only crucial to understanding trends and variability but also for water management resources and food security, ecological management, and weather, climate and hydrological forecasting. Here we present a few highlights showcasing how GPM IMERG is helping a variety of end users make decisions that will benefit society for years to come. GPM IMERG Data Used for Wind Energy Map of average precipitation in north-central...
GPM observes Hurricane Dorian lashing Florida
Download in high resolution from the NASA Goddard Scientific Visualization Studio GPM captured Dorian at 10:41 UTC (6:41 am EDT) on the 4th of September when the storm was moving north-northwest parallel to the coast of Florida about 90 miles due east of Daytona Beach. Three days earlier, Dorian had struck the northern Bahamas as one of the most powerful Category 5 hurricanes on record in the Atlantic with sustained winds of 185 mph. Weakening steering currents allowed the powerful storm to ravage the northern Bahamas for 2 full days. During this time, Dorian began to weaken due to its...
GPM Observes Hurricane Dorian Over Bahamas
Download in high resolution from the NASA Goddard Scientific Visualization Studio. The NASA / JAXA Global Precipitation Measurement (GPM) Core Observatory flew over Hurricane Dorian on September 1st (5:22pm ET / 21:22 UTC) as the storm was directly over Abaco Island in The Bahamas. The satellite captured data on rainfall rates within the storm as it flew over using its Dual-frequency Precipitation Radar (DPR) and GPM Microwave Imager (GMI). In this animation the multi-satellite GPM IMERG product is shown first to illustrate rainfall rates prior to the overpass. When the camera zooms in data...
Hurricane Dorian Brings Heavy Rain to Bahamas
In addition to the powerful winds that have raked the northern Bahamas over the past few days, Hurricane Dorian’s slow motion has brought very heavy rainfall to the islands as well. Dorian first formed into a tropical depression on the 24th of August about 800 miles east southeast of Barbados in the Lesser Antilles from an area of low pressure; the depression was quickly upgraded to a minimal tropical storm and named Dorian by the National Hurricane Center (NHC) later in the day. As Dorian made its way westward under the influence of a high pressure ridge to the north, it was held in check...
IMERG Measures Rainfall in Hurricane Dorian
UPDATE 9/9/19: On Monday morning, September 9, Hurricane Dorian was a post-tropical storm after a mid-latitude weather front and cold seas had altered its tropical characteristics over the weekend. On Saturday and Sunday, Hurricane Dorian struck eastern Canada, causing wind damage and bringing heavy rainfall. According to the Associated Press, a peak of 400,000 people were without power in Nova Scotia, Canada, because of Dorian. This graphic shows precipitation that fell during the almost two-week period from August 27 to the early hours of September 9. The near-realtime rain estimates come...
Rain Patterns During the Alaska Wildfires
NASA's satellite-based estimate of global precipitation can provide valuable information to officials monitoring the many wildfires in Alaska this summer. Wildfires occur in Alaska each summer, but July 2019 is shaping up to be a particularly active month. Few rain gauges exist in the large tracts of Alaskan wilderness, but wildfires unchecked can spread to populated areas within the state. Satellite-based precipitation estimates are particularly valuable here because of precipitation's relationship to wildfire hazard. The movie shows NASA's IMERG precipitation estimates for May 1 through July...
5 Year Anniversary of Hurricane Arthur
TRMM overpass of Hurricane Arthur from July 3, 2014. View fullscreen in STORM Event Viewer June marks the official start of the Atlantic hurricane season. And although strong tropical cyclones are rare in June in the Atlantic, it will soon be the 5-year anniversary of Hurricane Arthur, which became a tropical depression in very late June 2014 before hitting the Outer Banks of North Carolina as a Category 2 hurricane in early July. As with most storms early in the season, Arthur formed not from a tropical wave moving off the coast of Africa but from an old frontal boundary that stalls off the...
2019 Hurricane Season Banner
NASA has a unique and important view of hurricanes around the planet. Satellites and aircraft watch as storms form, travel across the ocean and sometimes, make landfall. After the hurricanes have passed, the satellites and aircraft see the aftermath of hurricanes, from downed forests to mass power loss.
GPM Catches Typhoon Yutu Making Landfall
NASA's GPM Core observatory satellite captured an image of Super Typhoon Yutu when it flew over the powerful storm just as the center was striking the central Northern Mariana Islands north of Guam. Early Thursday, Oct. 25 local time, Super Typhoon Yutu crossed over the U.S. commonwealth of the Northern Mariana Islands. It was the equivalent of a Category 5 hurricane. The National Weather Service in Guam said it was the strongest storm to hit any part of the U.S. this year. Download this video in high resolution from the NASA Goddard Scientific Visualization Studio Download video without...
Dive Into a 360-View of Hurricane Maria
Two days before Hurricane Maria devastated Puerto Rico, the NASA/JAXA Global Precipitation Measurement Core Observatory satellite captured a 3D view of the 2017 storm. At the time Maria was a category 1 hurricane. The 3-D view reveals the processes inside the hurricane that would fuel the storm’s intensification to a category 5 storm within 24 hours. For the first time in 360 degrees, this data visualization takes you inside the hurricane. The precipitation satellite has an advanced radar that measures both liquid and frozen water. The brightly colored dots show areas of rainfall, where green...

Hide Date