Extreme Weather News

Jump to a Year

2024 | 2023 | 2022 | 2021 | 2020

2019 | 2018 | 2017 | 2016 | 2015

2014 | 2013 | 2012 | 2011 | 2010

2009 | 2008 | 2007 | 2006 | 2005

2004 | 2003 | 2002

GPM Shows Rainfall Southeast Of Sheared Tropical Cyclone Iris

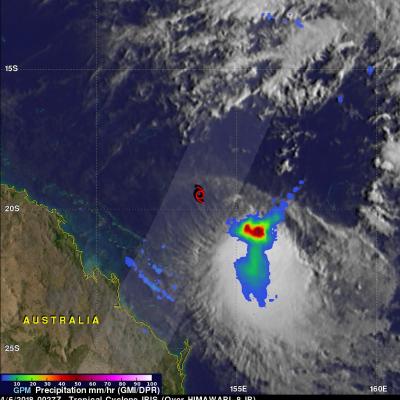
The GPM core observatory satellite again passed over the center of tropical cyclone IRIS on April 6, 2018 at 0027 UTC (10:27 AM AEST). The location of IRIS' low level center of circulation is shown here with a red tropical storm symbol. Data collected by GPM's Microwave Imager (GMI) revealed that heavy convective rainfall was sheared to the southeast of IRIS' surface center of circulation. Those GMI data showed that precipitation in that area of strong convection was falling at a rate greater than 59 mm (2.3 inches) per hour while data received by GPM's Dual Frequency Precipitation Radar (DPR)

GPM Satellite Probes Tropical Cyclone Iris Near Australian Coast

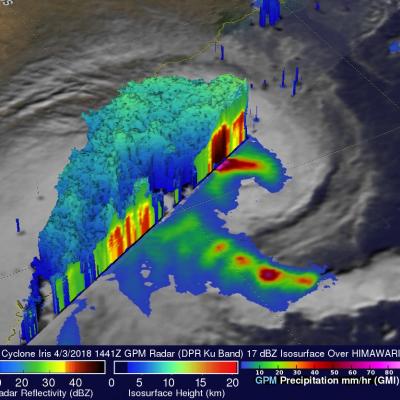
IRIS has taken a long, fluctuating and serpentine trek since the tropical cyclone formed in the Coral Sea northeast of Australia on March 24. For a while IRIS weakened and was downgraded to a tropical low. The tropical low moved toward the northeastern coast of Australia and was upgraded again to tropical cyclone IRIS on April 2. The tropical cyclone has then moved generally southeastward parallel to the Australian coast. This analysis from data collected by Microwave Imager (GMI) and Dual Frequency Precipitation Radar (DPR) instruments shows that extremely heavy rain was falling west of IRIS'

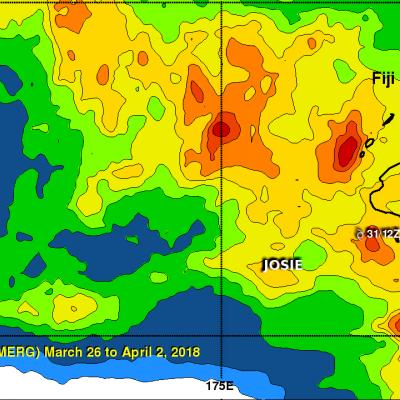
Tropical Cyclone Josie's Deadly Flooding Rainfall Examined With IMERG

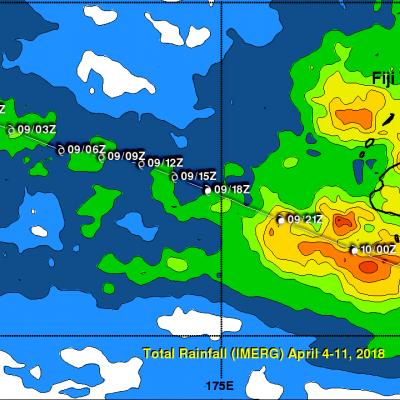
Tropical cyclone Josie didn't make landfall in Fiji but it's heavy rainfall resulted in deadly flooding. Approximate locations of tropical cyclone Josie, as it moved close to Fiji, are shown overlaid in white. Josie's clockwise circulation streamed moisture over Fiji causing flooding that led to the deaths of at least four people. This rainfall accumulation analysis used Integrated Multi-satellitE Retrievals for GPM (IMERG) data. Those data are generated by NASA's Precipitation Processing System every half hour within about 6 hours from when data are acquired. IMERG data are acquired from the

GPM Sees Jelawat Becoming A Typhoon

Tropical storm JELAWAT intensified as expected and was upgraded to typhoon JELAWAT yesterday. Today JELAWAT has continued to rapidly intensify and maximum sustained wind speeds in the typhoon were estimated at 115 kts (132 mph). The GPM core observatory satellite had an excellent view of rapidly intensifying tropical storm JELAWAT on March 29, 2018 at 1546 UTC. JELAWAT had wind speeds of about 60 kts (69 mph) when GPM passed over head. An eye hadn't formed yet but rain bands were wrapping around JELAWAT's well established center of circulation. GPM's radar (DPR Ku Band) revealed that rain was

Intensifying Tropical Storm Jelawat Evaluated By GPM

The GPM core observatory satellite flew almost directly above large intensifying tropical storm JELAWAT on March 28, 2018 at 0510 UTC. Rainfall measurements shown here were derived from data collected by GPM's Microwave Imager (GMI) and Dual Frequency Precipitation Radar (DPR) instruments. These satellite instruments provided excellent coverage of JELAWAT's precipitation. GPM's Radar (DPR Ku Band) swath included exceptionally powerful storms within a large intense feeder band that was wrapping around the eastern side of the tropical storm. GPM's DPR revealed that these strong convective storms