GPM Examines Snow in Destructive Nor'easter
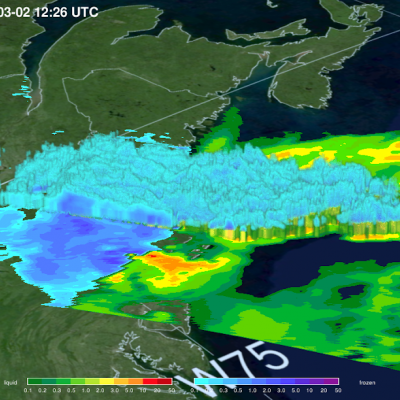
Early in the morning of March 2nd 2018 the GPM satellite flew over the "Nor'easter" winter storm that is battering the eastern U.S. with damaging winds, rain, snow, and hail. View this data in STORM Event Viewer: https://pmm.nasa.gov/storm-viewer/EVMicro.html?storm=Riley&date=20180302 Images and caption by Jacob Reed (Telophase / NASA GSFC)