Extreme Weather News

Jump to a Year

2024 | 2023 | 2022 | 2021 | 2020

2019 | 2018 | 2017 | 2016 | 2015

2014 | 2013 | 2012 | 2011 | 2010

2009 | 2008 | 2007 | 2006 | 2005

2004 | 2003 | 2002

GPM Views Potential Australian Tropical Cyclone

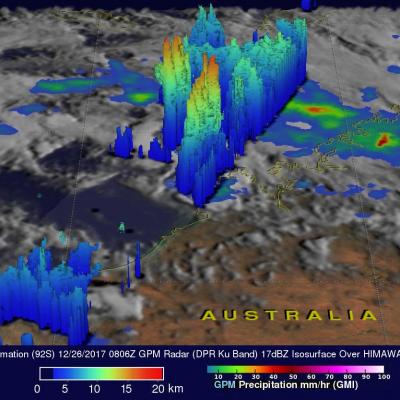
On December 26, 2017 at 0806 UTC The GPM core observatory satellite satellite flew above northwestern Australia. GPM traveled over an area of convective thunderstorms in the Indian Ocean north of Australia's coast where a tropical cyclone is expected to develop. GPM's Microwave Imager (GMI) and Dual-Frequency Precipitation Radar (DPR) instruments collected data that showed heavy precipitation in storms off the Australian coast. GPM's radar (DPR Ku Band) showed that a few extremely powerful convective storms northwest of the Dampier Land coast were dropping precipitation at a rate of greater

Tropical Storm Tembin Rainfall Added To IMERG Analysis

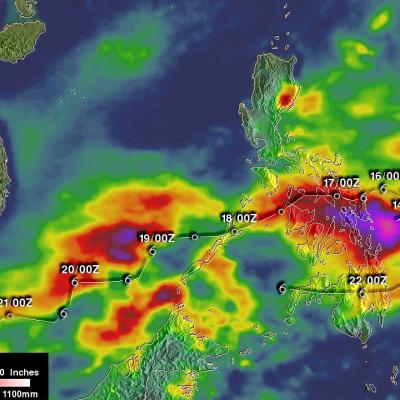
Tropical storm Tembin moved over the Philippine island of Mindanao on Friday December 22, 2017. Tembin added to the death and destruction already caused by tropical storm Kai-Tak that hit the central Philippines less than a week ago. Tembin brought heavy rainfall that resulted in more deadly flooding and landslides. At least eight deaths in the Philippines have been blamed on tropical storm Tembin. Rainfall totals in this accumulation analysis were updated to include IMERG data from both tropical storms Kai-Tak and Tembin. This rainfall analysis shows rainfall accumulation estimates from IMERG

Deadly Tropical Storm Kai-tak Examined With IMERG And GPM Satellite

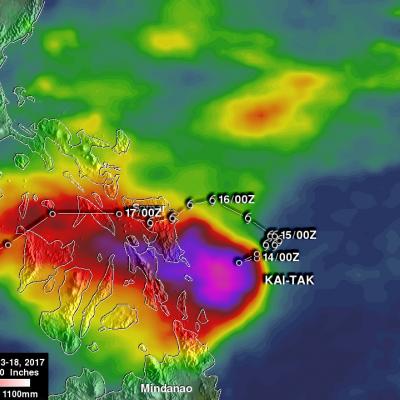
Tropical storm KAI-TAK was nearly stationary at times as it drenched the Philippines during the past five days. The storm caused major flooding and landslides. Many homes, roads and bridges were reported destroyed by landslides. Over 30 deaths were caused by the slow-moving tropical storm. A rainfall accumulation analysis of tropical cyclone KAI-TAK was derived from NASA's Integrated Multi-satellitE Retrievals data (IMERG) for the period from December 13-18, 2017. Tropical cylone KAI-TAK's approximate locations and positions are shown overlaid in white on this analysis. IMERG data were used to

GPM Sees Ockhi's Rain Reaching India's Western Coast

NASA's GPM Core Observatory satellite passed over western India on December 5, 2017 at 0521 UTC. GPM's Microwave Imager (GMI) and Dual-Frequency Precipitation Radar (DPR) instruments showed precipitation from dissipating tropical cyclone OCKHI reaching India's western coast. GPM's radar (DPR Ku band) indicated that rain was falling at a rate of over 101.6 mm (4 inches) per hour in a few storms near India's coast. OCKHI's low level center of circulation, shown with a red tropical cyclone symbol, was located well to the southwest of the storms that were moving onto India's western coast. This 3

Tropical Cyclone Ockhi's Rainfall Examined By GPM

On December 2, 1027 OCKHI became the first tropical cyclone of the year to form in the Arabian Sea. Fortunately for India the tropical cyclone remained off India's southwestern coast. OCKHI intensified to the equivalent of a category 3 hurricane on the Saffir-Simpson hurricane wind scale before it started to weaken. Vertical wind shear caused OCKHI to weaken as the tropical cyclone started moving north-northeastward toward India's Gulf of Khambhat. NASA's GPM Core Observatory satellite passed over tropical cyclone OCKHI on December 4, 2017 at 0616 UTC. The rainfall coverage shown here was