Extreme Weather News

Jump to a Year

2024 | 2023 | 2022 | 2021 | 2020

2019 | 2018 | 2017 | 2016 | 2015

2014 | 2013 | 2012 | 2011 | 2010

2009 | 2008 | 2007 | 2006 | 2005

2004 | 2003 | 2002

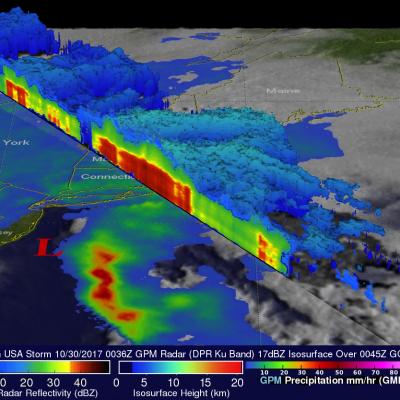
Powerful Northeastern Storm Examined By GPM Satellite

The GPM satellite showed the distribution and intensity of precipitation on the eastern side of the low pressure center. The approximate location of the storm's center at the time of the GPM pass is shown with a large red "L". GPM's Microwave Imager (GMI) showed that a large area of intense rain was located in the Atlantic east of the low's center. GMI estimated that rain in that area was falling at rates of greater than 2 inches (51 mm) per hour. GPM's Precipitation Radar (DPR) instrument showed that the low was dropping rain at a rate of over 4.92 inches (125 mm) per hour in a small area

GPM Measures Tropical Storm Saola's Rainfall

The GPM core observatory had a fairly good view of tropical storm Saola on October 27, 2017 at 0243 UTC. This image shows the GPM satellite's coverage (lighter shades) of surface rainfall around tropical storm Saola. GPM's Microwave Imager (GMI) and Dual-Frequency Precipitation Radar (DPR) instruments received data showing the intensity of rainfall over the western half of tropical storm Saola. GPM's radar (DPR Ku Band) discovered that rain was falling at a rate of over 66 mm (2.6 inches) per hour in feeder bands wrapping around that side of the tropical storm. The most intense convective

GPM Observes Another Typhoon That May Threaten Japan

The GPM core observatory satellite passed above recently formed tropical storm Saola on October 24, 2017 at 0210 UTC. Tropical storm Saola was located west of Guam and was moving toward the northwest. Very heavy rainfall was measured by GPM's Microwave Imager (GMI) and Dual-Frequency Precipitation Radar (DPR) instruments in powerful convective storms to the southwest of Saola's center. GPM's radar (DPR Ku band) found that some storms in this cluster were dropping rain at a rate of greater than 252 mm (9.92 inches) per hour. This 3-D view of the powerful storms southwest of Paola's center of

GPM Examines Deadly Typhoon Lan

Typhoon Lan caused flooding, landslides and the death of at least seven people when it hit Japan early Monday morning. The powerful typhoon was accompanied by high winds and extremely heavy rainfall. Rain totals of 800 mm (31.5 inches) were reported in parts of south central Honshu. Wind speeds of over 106 kts (121.9 mph) were also reported. On October 22, 2017 at 0556 UTC the "core" satellite of the Global Precipitation Measurement (GPM) mission had an excellent view of Lan as the typhoon was approaching Japan. Data collected by GPM's Microwave Imager (GMI) and Dual-Frequency Precipitation

GPM Sees Intensifying Typhoon Lan Heading Toward Japan

Tropical depression twenty five (TD25W) formed in the western Pacific Ocean west of Yap on October 15, 2017. After that the intensifying tropical cyclone moved into the Philippine Sea. Tropical storm Lan recently moved toward the north and was upgraded to typhoon Lan. Maximum sustained wind speeds today (October 19, 2017) were estimated to have reached 75 kts (~86 mph). This wind speed makes it a category one on the Saffir-Simpson hurricane wind scale. Extremely warm ocean waters (30-31 degrees Celsius) along Lan's path are providing fuel for further intensification. On October 18, 2017 at