Logo for GPM Applications showing ecology, water and agriculture, energy, disasters, health, and weather.

Applications


Overview

The Global Precipitation Measurement (GPM) mission has several cross-cutting application areas which contribute to and enhance our understanding of weather forecasting, disasters, ecology, health, water and agriculture and energy. Using advanced space-borne instruments, GPM measures light rain to heavy rain and falling snow, producing a near-global view of precipitation every 30 minutes. Through improved measurements of rain and snow, precipitation data from the GPM mission is used by a diverse range of applications and user communities at local to global scales to inform decision making and policy that directly benefits society. 

Sections

What are Applications? 

“Applications” refers to the use of mission data products in decision-making activities for societal benefit. Mission Applications take a satellite's data products and expands them into areas where they can help inform policy or decisions. 

Learn more about Applied Sciences at NASA

Who's Using GPM Data?

Learn about the different people and organizations that are using GPM and other NASA Earth data to help improve life around the world. 

View Articles


GPM Mentorship Program

NASA’s GPM applications team and University of Coimbra’s Earth and Space Science Center (CITEUC Portugal) have collaborated to host the GPM Mentorship Program for several years.

The program supports new and existing user communities to provide a tailored hands-on learning experience in using GPM data for applications. It provides participants with training and tools to use state-of-the-art GPM satellite-based precipitation estimates, and helps them apply GPM data to support real-world problems and benefit their communities. 

Learn more about each GPM Mentorship Program session2024, 2023, 2022


GPM Data for Decision Making

Are you using GPM satellite precipitation data in your work, or would you like to? Share your story with our team, or ask us any questions you may have using our contact form.

We also encourage you to get involved in GPM applications by attending an applications event or accessing the free and publicly available data in the data section of this site

  • Dalia Kirschbaum (NASA GSFC), GPM Mission Associate Deputy Project Scientist for Applications
  • Andrea Portier (NASA GSFC / SSAI), GPM Applications and Outreach Coordinator
  • Dorian Janney (NASA GSFC / ADNET), GPM Outreach Specialist
  • Jacob Reed (NASA GSFC / Telophase), GPM Web Developer

Applications Featured Resources

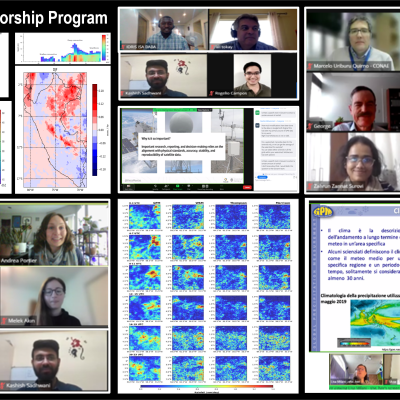
A collection of screenshots from the GPM Mentorship program
In 2023, NASA’s Global Precipitation Measurement Mission Applications Team and University of Coimbra’s Earth and Space Science Center (CITEUC Portugal) collaborated to host the second edition of the GPM Mentorship Program. The initiative supported new and existing user communities, providing a tailored hands-on learning experience in using GPM data for applications. It gave participants an overview of state-of-the-art GPM satellite-based precipitation estimates and provided users with examples of applying GPM data to support real-world problems. The program offered a free, online, and
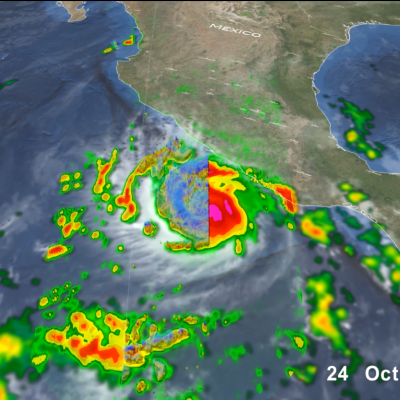
GPM Overpass of Hurricane Otis
After rapidly intensifying overnight, Hurricane Otis made landfall near Acapulco, Mexico around 1:25 a.m. CDT (06:25 UTC) on Wednesday Oct. 25 as a powerful Category 5 hurricane. Otis had maximum sustained winds estimated at 165 mph by the National Hurricane Center (NHC), making it the first Category 5 as well as the most powerful storm to hit the Pacific coast of Mexico on record. Otis formed into a tropical depression (TD 18-E) on the morning of Sunday Oct. 22 about 530 miles (850 km) south-southeast of Acapulco from a broad area of low pressure. The depression was moving slowly northward
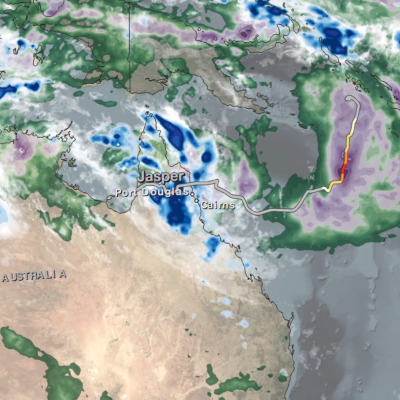
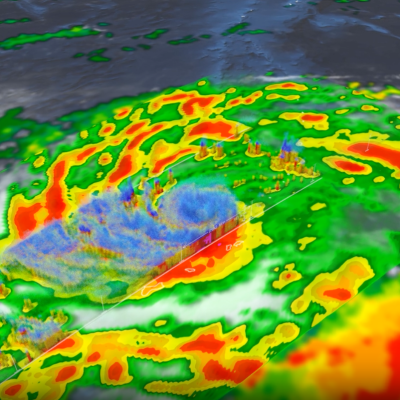
GPM Overpass of Cyclone Bolaven
Typhoon Bolaven began as a tropical depression over the West Pacific Ocean on Oct. 7, 2023. On Oct. 10, Bolaven became a Typhoon and passed over the Mariana Islands as it tracked to the northwest. Bolaven then rapidly intensified over 12 hours from a Category 1 to a Category 5 storm on the Saffir-Simpson scale, starting around 12 UTC on Oct. 10. Several factors contributed to the rapid intensification, including modest shear in the atmosphere and warm sea-surface temperatures. This animation shows precipitation within Typhoon Bolaven around the time that rapid intensification began. The global
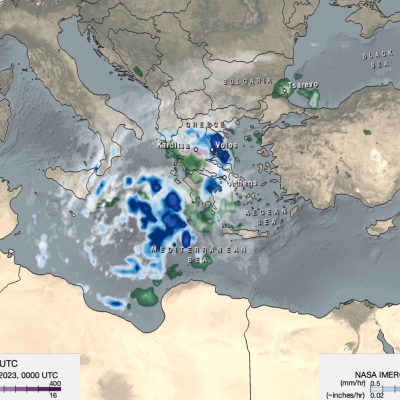
Map of IMERG precipitation estimates from recent flooding rainfall in Greece.
On Sept. 4, 2023, a low-pressure system developed over southeastern Europe that would lead to devastating floods over Greece and other parts of the region. The system was given the name “Daniel” by local meteorological agencies. Daniel was dynamically driven by strong cyclonic flow in the upper-level winds over southeastern Europe. The upper-levels winds combined with low-level winds from the northeast which supplied moisture from the unusually warm waters of the Aegean and Black Seas to central Greece. According to satellite infrared and microwave estimates from NASA's MUR and NOAA’s OISST v2
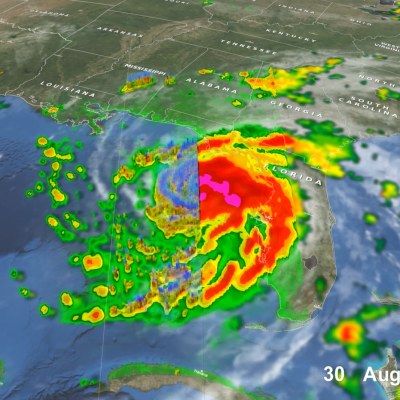
GPM Overpass of Hurricane Idalia
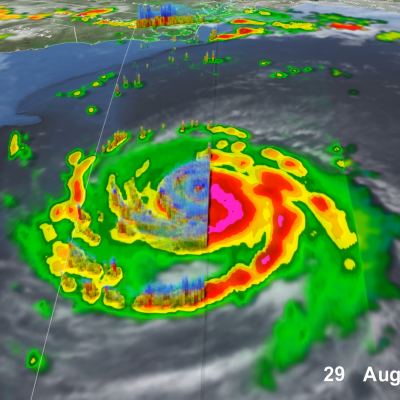
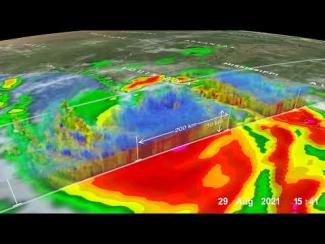
After threatening much of Florida’s western coast, Hurricane Idalia made landfall Wednesday morning in the Big Bend region of Florida’s northwest coast near Keaton Beach at 7:45 a.m. EDT, Aug. 30, as a strong Category 3 storm with sustained winds reported at 125 mph by the National Hurricane Center. Idalia’s formation was somewhat unusual. Typically, when entering the heart of the hurricane season tropical storms and hurricanes form and expand eastward across the tropical Atlantic region towards Africa’s coast. However, storms occasionally still form in the western Caribbean, as was the case
GPM Overpass of Tropical Storm Franklin on Aug. 29 2023
After becoming a tropical storm in the east-central Caribbean on the afternoon of Aug. 20 and moving generally westward for two days, Tropical Storm Franklin took a northward track and struck the southern coast of the Dominican Republic south of Barahona on the morning of Aug. 23 as a moderate tropical storm with sustained winds reported at 50 mph by the National Hurricane Center (NHC). Franklin brought heavy rains and flooding to the area, resulting in landslides, power outages and at least 2 fatalities in the Dominican Republic according to media reports. After traversing the mountainous
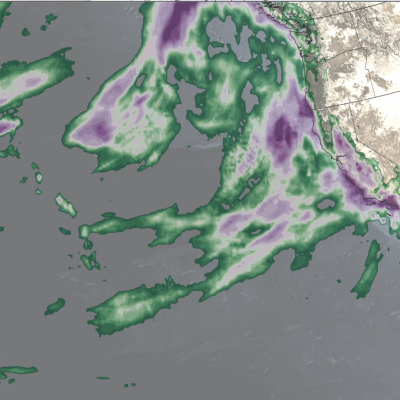
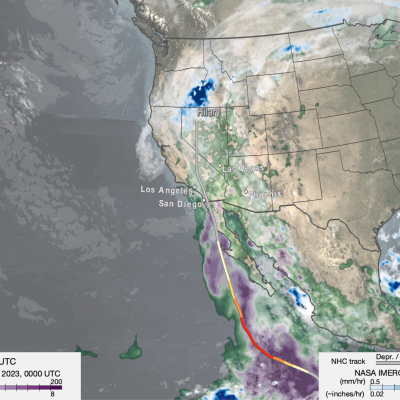
IMERG rainfall totals from Hurricane Hilary.
Hurricane Hilary is being hailed as a historic storm after becoming the first tropical storm to hit California since Sept. 24, 1939. The storm has had a large impact on the region - in addition to gusty winds, Hilary’s rains have resulted in widespread flooding, landslides, washed out roads and numerous other closures. Like most East Pacific tropical cyclones, Hilary originated from a westward propagating tropical wave that crossed over Central America from the western Caribbean into the eastern Pacific. Known as “African easterly waves”, these are the same waves that emerge off the coast of
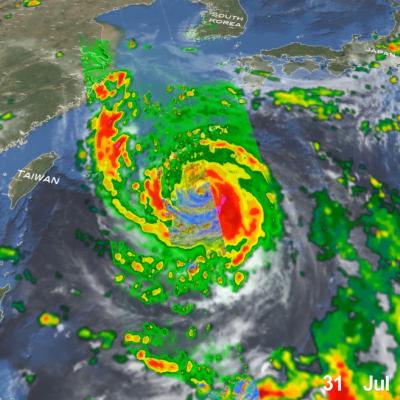
GPM Overpass of Typhoon Khanun
The Northwest Pacific typhoon season has been quite active recently. Following in the wake of Super Typhoon Doksuri, which skirted the northern tip of Luzon July 25 and 26 and continued on to bring extreme rainfall to southeast coast of China, is yet another powerful storm - Typhoon Khanun. Khanun (known as “Falcon” in the Philippines) began in the West Pacific Ocean as an area of disturbed weather on July 24 situated well south of Guam and east of Palau. Over the next several days the system slowly intensified as it tracked northwestward towards the Ryuku Islands of southern Japan, becoming a
GPM Overpass of Hurricane Calvin on July 14
After a quiet start, the 2023 eastern Pacific hurricane season recently picked up in activity with the formation of the season’s first major hurricane, Hurricane Calvin. Calvin originated on July 11 from an area of low pressure located about 510 miles (~820 km) south-southwest of Manzanillo, Mexico, which had become organized enough for the National Hurricane Center (NHC) to declare it Tropical Depression 3E (TD 3E) that afternoon. Located over warm sea surface temperatures (SSTs) of around 84 oF (29 oC), thunderstorm activity near the center of TD 3E continued to increase overnight, and
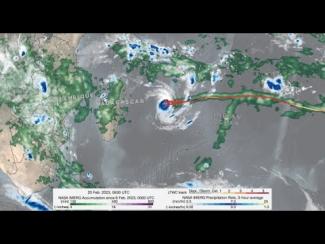
IMERG rainfall totals from Cyclone Freddy
Tropical Cyclone Freddy first made landfall along the east coast of Madagascar just north of the town of Mananjary on Feb. 21, 2023, as a Category 3 cyclone with average winds reported at ~81 mph (130 km/h) and gusts up to ~112 mph (180 km/h). After crossing over Madagascar Freddy continued westward over the Mozambique Channel before making landfall again along the east coast of Mozambique just south of Vilankulos as a moderate tropical storm with sustained winds estimated at 50 mph. Despite being weaker at landfall, Freddy caused widespread flooding across parts of Mozambique due to the storm stalling out near the coast after making landfall. Incredibly, Freddy drifted back out over the Mozambique Channel, nearly making landfall along the southwest coast of Madagascar. It then changed direction, re-intensified, weakened, re-intensified one last time, and made landfall once again on March 11 near Quelimane, Mozambique, as a Category 1 cyclone with sustained winds reported at 90 mph.

GPM IMERG precipitation rates and totals from Tropical Cyclone Freddy, Feb. 6 - March 12, 2023. Credit: NASA 

Download in high resolution from the NASA Goddard Scientific Visualization Studio

In a series of three half-day virtual meetings, this workshop will focus on current applications and future opportunities of NASA precipitation and cloud data products to support transport and logistical activities for aviation, maritime, roads and highway transportation systems. The workshop will bring together representatives from federal and state operational agencies and private companies to discuss how NASA precipitation and cloud products could be better leveraged to inform decision-making for transport and logistical operations. The workshop will also provide an opportunity for end...

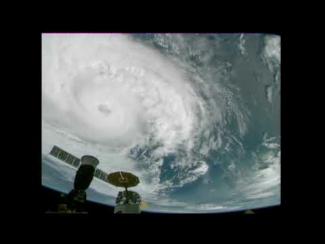
Cameras outside the International Space Station captured dramatic views of Hurricane Zeta at 12:50 pm ET October 28, as it churned 200 miles south-southwest of New Orleans packing winds of 90 miles an hour. Credit: NASA International Space Station

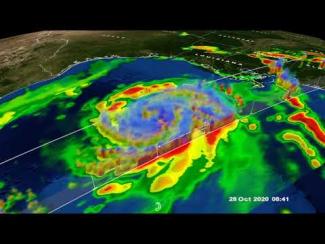
GPM Core Observatory overpass of Tropical Storm Zeta on October 28 at approximately 3:25am CDT (8:25 UTC). Credit: NASA Goddard Scientific Visualization Studio

View an interactive 3D visualization of this overpass in STORM Event Viewer

Hide Body

Hide Date

Hide Main Image

Hide Title