Intensifying Hurricane Lane Examined by GPM Satellite
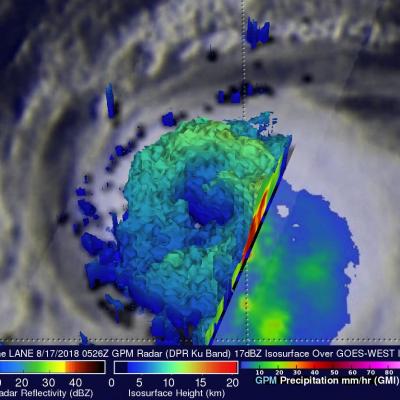
View fullscreen in STORM Event Viewer Heavy rainfall and towering cloud heights were the findings when Hurricane Lane was scanned by the Global Precipitation Measurement mission or GPM core observatory satellite on Aug. 17. Lane strengthened to a Category 2 hurricane on the Saffir-Simpson Hurricane Wind Scale. GPM passed above Lane in the Eastern Pacific Ocean on Aug. 17, 2018, at 1:26 a.m. EDT (0526 UTC). Lane was intensifying and data collected by GPM's Microwave Imager (GMI) and Dual-Frequency Precipitation Radar (DPR) instruments revealed the location of its forming eye wall. Very heavy