Extreme Weather News

Jump to a Year

2024 | 2023 | 2022 | 2021 | 2020

2019 | 2018 | 2017 | 2016 | 2015

2014 | 2013 | 2012 | 2011 | 2010

2009 | 2008 | 2007 | 2006 | 2005

2004 | 2003 | 2002

Slow-moving Frontal System Brings Heavy Rains, Flooding to Parts of Texas

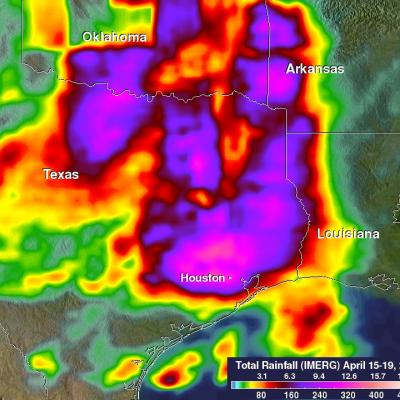
A slow-moving frontal system associated with a stagnant upper-air pattern set the stage for heavy rains and flooding early this week from East Texas all the way up through the Central and Northern Plains. The hardest hit region was in and around the Houston area. On Monday, the National Weather Service reported that Houston International Airport broke its all time daily rainfall record with 9.92 inches of rain. Elsewhere in Harris County, over 17 inches of rain was recorded as of Monday evening. The main culprit was a stationary upper-level low pressure center spinning over the Central Rockies

GPM Views Increasingly Powerful Tropical Cyclone Fantala

Tropical cyclone Fantala has continued to intensify while moving westward over the open waters of the South Indian Ocean. The GPM core observatory satellite passed directly over Fantala's eye on April 14, 2016 at 0148 UTC. At that time the tropical cyclone had maximum sustained winds estimated at 90 kts (104 mph) making in the equivalent of a category two tropical cyclone on the Saffir-Simpson hurricane wind scale. GPM's Microwave Imager (GMI) and Dual-Frequency Precipitation Radar (DPR) instruments again captured data that were used to estimate rainfall within Fantala. Rain was measured by

Tropical Cyclone Fantala Formation Seen By GPM

A tropical cyclone called Fantala formed in the South Indian Ocean far to the east of Madagascar on on April 11, 2016. Fantala has slowly intensified while moving westward and is expected become even more powerful. The GPM core observatory satellite flew over Fantala (TC19S) on April 10, 2016 at 0206 UTC when the tropical cyclone was forming. The first image shows a rainfall analysis using data captured with by GPM's Microwave Imager (GMI) and Dual-Frequency Precipitation Radar (DPR) instruments. GPM rainfall is shown overlaid on a 0200Z METEOSAT-7 Visible and Infrared image. Intense

Weakening Tropical Cyclone Zena's Rain Measured By GPM

Heavy rain was reported as weakening tropical cyclone Zena passed quickly by Tonga. Tropical cyclone Zena was in the process of being torn apart with strong vertical wind shear. The GPM core observatory satellite passed above Zena on April 7, 2016 at 0841 UTC after the center of the tropical cyclone had moved to the east-southeast of Tonga. Zena's maximum sustained winds had dropped to about 35 kts (40 mph). Rainfall derived from GPM's Microwave Imager (GMI) data are shown overlaid on a 0900 UTC GOES-WEST enhanced infrared image. GPM's GMI revealed that weakening tropical cyclone Zena still

GPM Sees More Powerful Tropical Cyclone Zena

Tropical cyclone Zena intensified over the open waters between Vanuatu and Fiji. At peak intensity Zena had sustained winds estimated at about 90 kts (104 mph). The GPM core observatory satellite had an excellent view of tropical cyclone Zena on April 6, 2016 at 0933 UTC when tropical cyclone Zena was located southwest of Fiji. Zena had started to weaken but still had maximum sustained wind speeds estimated at 80 kts (92 kts). An analysis of GPM's Microwave Imager (GMI) and Dual-Frequency Precipitation Radar (DPR) data revealed the intensity of some very heavy showers in the tropical cyclone