Logo for GPM Applications showing ecology, water and agriculture, energy, disasters, health, and weather.

Applications


Image

Overview

The Global Precipitation Measurement (GPM) mission has several cross-cutting application areas which contribute to and enhance our understanding of weather forecasting, disasters, ecology, health, water and agriculture and energy. Using advanced space-borne instruments, GPM measures light rain to heavy rain and falling snow, producing a near-global view of precipitation every 30 minutes. Through improved measurements of rain and snow, precipitation data from the GPM mission is used by a diverse range of applications and user communities at local to global scales to inform decision making and policy that directly benefits society. 

Sections

What are Applications? 

“Applications” refers to the use of mission data products in decision-making activities for societal benefit. Mission Applications take a satellite's data products and expands them into areas where they can help inform policy or decisions. 

Learn more about Applied Sciences at NASA

Who's Using GPM Data?

Learn about the different people and organizations that are using GPM and other NASA Earth data to help improve life around the world. 

View Articles

2022 GPM Mentorship Program


GPM Data for Decision Making

Are you using GPM satellite precipitation data in your work, or would you like to? Share your story with our team, or ask us any questions you may have using our contact form.

We also encourage you to get involved in GPM applications by attending an applications event or accessing the free and publicly available data in the data section of this site

  • Dalia Kirschbaum (NASA GSFC), GPM Mission Associate Deputy Project Scientist for Applications
  • Andrea Portier (NASA GSFC / SSAI), GPM Applications and Outreach Coordinator
  • Dorian Janney (NASA GSFC / ADNET), GPM Outreach Specialist
  • Jacob Reed (NASA GSFC / Telophase), GPM Web Developer

Applications Featured Resources

IMERG Rainfall Totals from Cyclone Tauktae
NASA combined data from multiple satellites in the GPM Constellation to estimate precipitation rates and totals from Tropical Cyclone Tauktae in May 2021. The below animation shows precipitation rates (blue/yellow shading) and accumulations (green shading) at half-hourly intervals from May 12-19, 2021, derived from NASA's IMERG algorithm. Underneath the precipitation data, cloud cover is shown in shades of white/gray based on geosynchronous satellite infrared observations. On top of the precipitation data, the cyclone's approximate track is displayed based on estimates from the Joint Typhoon
World Resources Institute Ethiopia
NASA’s Earth observation data are used in a wide variety of ways to improve life for humans and other animals across the world every day. Our climate is changing, and these changes include differences in temperature and precipitation patterns around the globe. As you might imagine, these changes bring about both anticipated and unanticipated consequences that have a profound impact on people around the world. Many organizations are responding to the amazing yet complicated wealth of data that can be used to successfully monitor many aspects of our global environment. The World Resources
Caribou herd in the Yukon
Climate change increases need for global data The impacts of climate change are already having a profound effect on ecosystems. Changes in temperature and precipitation patterns affect species and communities in diverse ways, such as declines in species and species diversity, changing interactions between species, and modification of ecosystems. Effective ecosystem management is critical to maintaining and repairing the natural environments in order to reliably support human needs while conserving and sustaining ecological services and diversity. Imagine how a scientist studying the movement
Water next to a desert.
So Much Data, So Little Time NASA’s Earth-observing data are used daily in a wide variety of ways to improve life for humans and animals across the planet. Our climate is changing, and these changes are having a profound impact on communities and species in many ways. Changing extremes in precipitation and temperature are leading to a decline in species diversity, modification to ecosystems and animal habitats, as well as changing how some species interact with each other. To address this, many organizations are turning to the amazing yet complex wealth of Earth data, which can be used to
IMERG Precipitation Totals from Eastern Australia, March 16 - 23, 2021
During the week ending on March 23, 2021, two locations in Australia experienced unusually high rainfall totals. According to news reports a persistent system brought flooding rains to Australia's east coast from Brisbane to Sydney and points further south. The preliminary estimate from NASA's multi-satellite global precipitation analysis is that more than 24 inches fell just off the coast of Australia in 7 days with accumulations in coastal areas exceeding 16 inches. Near the Strzelecki Desert in central Australia, a storm system brought 8 inches of precipitation during the same 7-day period. Most of the rain fell during a 3-day period (0000 UTC on 20 March to 2359 UTC on 22 March).
IMERG Rainfall Rates and MUR Sea Surface Temperatures from the 2020 Hurricane Season
Forecasters predicted an above-normal hurricane season for 2020. They weren’t wrong. As the 2020 Atlantic hurricane season smashed records with an unprecedented 30 named storms , NASA’s Earth Applied Sciences Disasters Program stood up to the challenge. The Disasters Program helps leaders and responders at national, regional, and local levels leverage NASA’s technology and expertise to assess, predict, and understand disasters' impacts. The Disasters Program targets a wide range of hazards and disasters , and while NASA is not an operational response agency, the agency offers access to unique
IMERG Sees Winter Storms Impact the Southern U.S.
In mid-February 2021, large areas of the Continental United States experienced extreme cold temperatures as a result of a strong Arctic high pressure system. The cold temperatures were accompanied by several pulses of precipitation over the Southeast US through the mid-Atlantic, as well as the Pacific Northwest. The combination of cold temperatures and precipitation resulted in widespread power outages to millions of people in Texas, Kentucky, West Virginia, and Oregon, among other states.
IMERG Captures Rainfall from Tropical Cyclone Ana in Fiji
NASA combined data from multiple satellites to estimate the rainfall from Tropical Cyclone Ana in the Southwest Pacific Ocean amid an ongoing Madden-Julian Oscillation (MJO) event. The Madden-Julian Oscillation is a 20 to 90 day pattern of alternating wet and dry conditions that often begins in the tropical Indian Ocean and moves eastward into the Pacific. This animation shows rainfall rates (blue/yellow shading) and rainfall accumulations (green shading) at half-hourly intervals from January 26 - February 2, 2021, using NASA's IMERG algorithm, overlaid on shades of white/gray from NOAA
IMERG Rainfall Total from Week of Jan 25 2021
NASA combined data from multiple satellites to estimate the rainfall from an "atmospheric river" event over the U.S. West Coast in near real-time at half-hourly intervals from January 25 - 29, 2021. Atmospheric rivers are long, narrow corridors of water vapor that can lead to heavy precipitation when they encounter land. This animation shows estimated rainfall rates in blue and yellow shading and total rainfall accumulations in green shading, from NASA's IMERG algorithm, overlaid on shades of white and gray from NOAA infrared satellite data which shows cloudiness. On January 25, 2021, a low
IMERG Total from Cyclone Gati
On November 22, 2020, Cyclone Gati became the strongest storm to hit Somalia since satellite records began five decades ago. Gati made landfall with maximum sustained winds of 170 kilometers (105 miles) per hour, a category 2 storm on the Saffir-Simpson scale . The storm brought more than a year’s worth of rain to the region in two days. Local authorities report at least eight people were killed and thousands have been displaced. The map above shows rainfall accumulation from November 21-23, 2020. These data are remotely-sensed estimates that come from the Integrated Multi-Satellite Retrievals

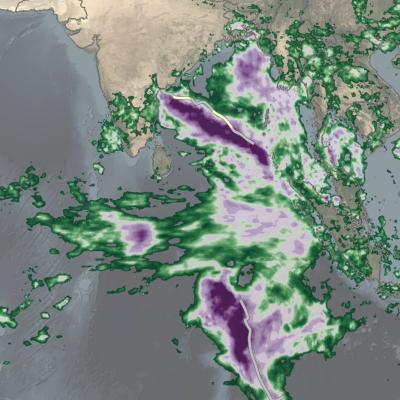
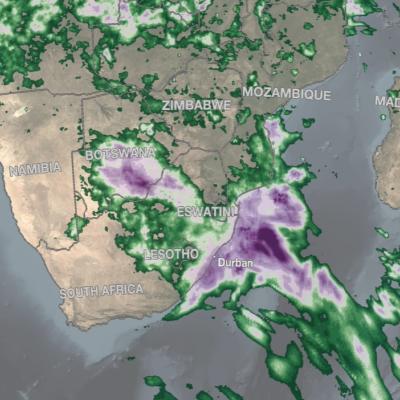
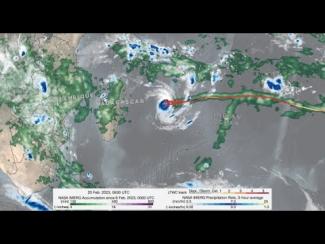
GPM IMERG precipitation rates and totals from Tropical Cyclone Freddy, Feb. 6 - March 12, 2023. Credit: NASA 

Download in high resolution from the NASA Goddard Scientific Visualization Studio

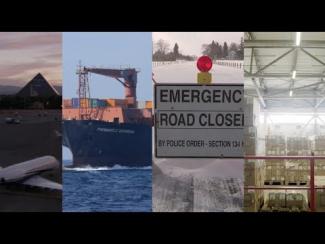
In a series of three half-day virtual meetings, this workshop will focus on current applications and future opportunities of NASA precipitation and cloud data products to support transport and logistical activities for aviation, maritime, roads and highway transportation systems. The workshop will bring together representatives from federal and state operational agencies and private companies to discuss how NASA precipitation and cloud products could be better leveraged to inform decision-making for transport and logistical operations. The workshop will also provide an opportunity for end...

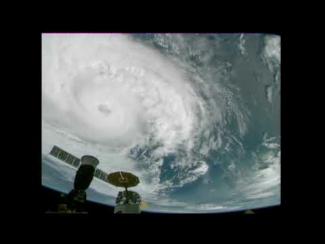
Cameras outside the International Space Station captured dramatic views of Hurricane Zeta at 12:50 pm ET October 28, as it churned 200 miles south-southwest of New Orleans packing winds of 90 miles an hour. Credit: NASA International Space Station

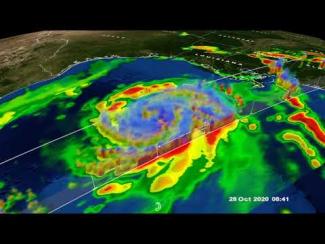
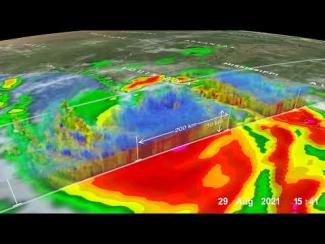
GPM Core Observatory overpass of Tropical Storm Zeta on October 28 at approximately 3:25am CDT (8:25 UTC). Credit: NASA Goddard Scientific Visualization Studio

View an interactive 3D visualization of this overpass in STORM Event Viewer

Hide Body

Hide Date

Hide Main Image

Hide Title